The peaks look distinct seen from afar
1929

2000 and 2007

But seen in real time they feel endless
2007

and day charts don't capture the intraday agony
1929

2000

And now take a look at 2014:
in perspective

and up close; 2014 looks eerily similar to 1929, right?
1929
1929

2014

the beginning of a comeback, or a head fake before the crash?
...and this is how 1929 continued of course:

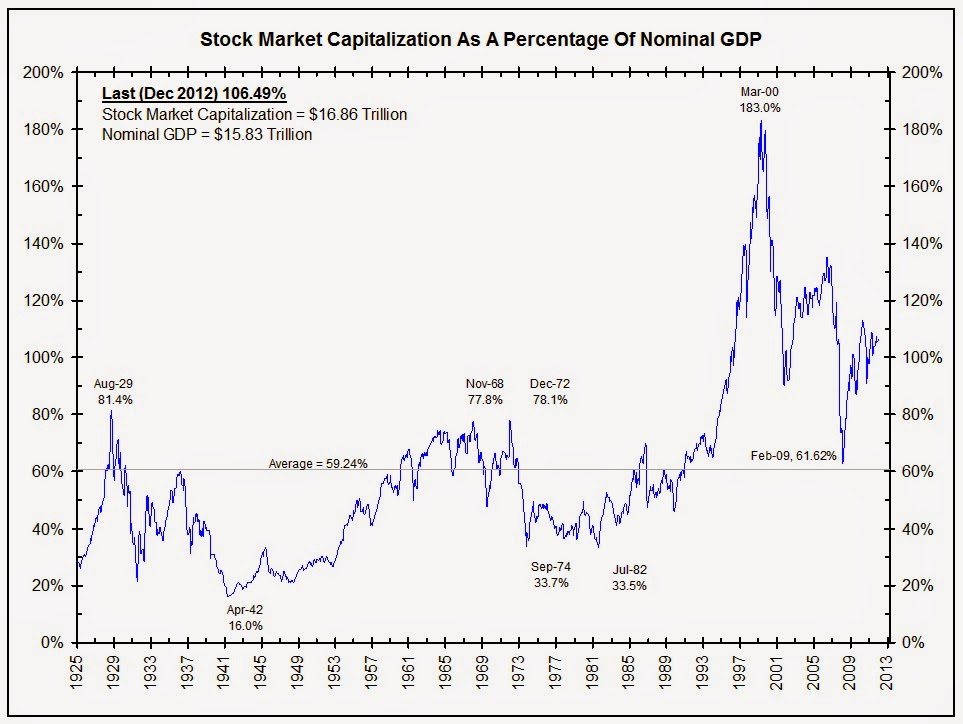
Today's valuation level almost reaches all the way up to the peak of peaks in 2000
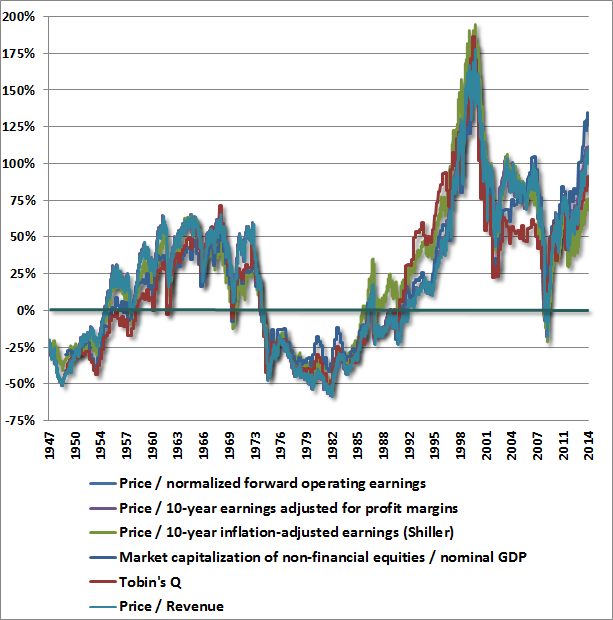
WAY above the level of 1929:
And, for perspective, valuation including the peak of 1929,
but only including up to January 2014